• 0
Votes
name

A PHP Error was encountered

Severity: Notice

Message: Undefined index: userid

Filename: views/question.php

Line Number: 216

Backtrace:

File: /home/thequizi/public_html/application/views/question.php
Line: 216
Function: _error_handler

File: /home/thequizi/public_html/application/controllers/Questions.php
Line: 475
Function: view

File: /home/thequizi/public_html/index.php
Line: 315
Function: require_once

OFFENSE OR DEFENSE? g with one goal in mind: to win the World Series. Every March teams go to Spring Trainin In baseball there is debate about how to construct winning teams. Should it be a line-up of big-time hiters or a roster buit around pitching and defense? Of course balance is key, but what if you had to choose? Totals between the 2014-2016 MLB Seasons In the table, data is totaled from the 2014, 2015 and 2016 MLB seasons. Although many other statistics exist that could help us, we will simply look at two: Runs Scored (Offense) and Runs | Arizona Diamondbacks | Allowed (Defense). Which will be more highly correlated with a teams Winning Percentage? Runs ScoredAllowed Winning Runs 2345 2087 0.440 1799 2136 0.436 | Atlanta Braves Baltimore Orioles Boston Red Sox Chicago Cubs Chicago VWhite Sox Cincinnati Reds Cleveland Indians Calorado Rackies 0.547 2160 2001 0.498 2250 2162 0.5622102 1871 0.467 1967 2174 0.428 1951 2220 0.535 21031969 0.430 23382522 0.514 22012229 0.494 2082 2042 1977 0.529 2152 2032 Los Angeles Dodgers 0.570 2098 1850 0.467 1917 2034 0.459 1976 2127 0.436 2134 2366 calculate lines of best fit and compute New York Mets 0.527 1991848 0.525 2077 2064 0.463 2076 2062 0.426 1856 2292 0.543 2108 1985 1870 2078 San Francisco Giants | 0512 | 2129 1987 PREDICTION #1a) Do you expect Runs Scored or Runs Allowed to have a stronger correlation Winning Percentage? rs Houston Astros Kansas City Royals Los Angeles Angels 0.5452051 Miami Marlins Milwaukee Brewers Minnesota Twins In this assignment, use graphing technology to create scatterplots the correlation coefficients for eachNew York Yankees relationship. 1b) Oakland Athletics Philadelphia Phillies Pittsburgh Pirates San Diego Padres0451 Seattle Mariners St. Louis Cardinals Tampa Bay Rays 0.533 2000 1872 0.568 2045 1840 0.463 1928198 Texas Rangers 0.514 2149 2263 0.545 2366 2022 Washington Nationals 0.5642152 1802 Toronto Blue Jays


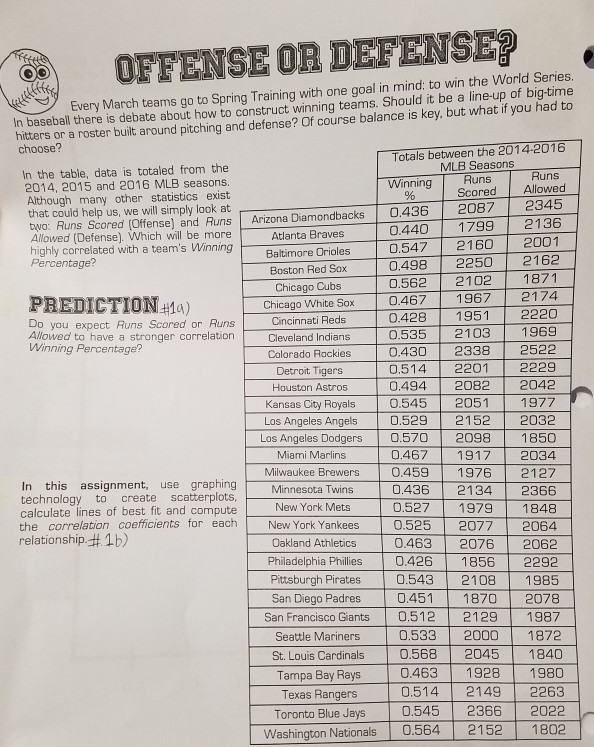
Need answers for questions as follows

Runs scored
- what is equation for line of best fit in a scatter plot

- What is the correlation coefficient (r) of this relationship?

- Does a correlation exist between these statistics? Describe the strength of the relationship. What does it mean?


and i need answers for the same questions but for the runs allowed
What is the correlation coefficient (r) of this relationship?


Popular Questions

Trending Tags

Related Questions